Pprof
Go pprof And Prometheus
在代码中使用
1
2
3
4
5
6
7
8
9
10
11
12
13
14
15
import (
  ...
	_ "net/http/pprof"
  "github.com/prometheus/client_golang/prometheus/promhttp"
  ...
)

func main() {

 	go func() {
		http.Handle("/metrics", promhttp.Handler())
		_ = http.ListenAndServe("14111", nil) // '14111' 建议使用flag
	}()

}
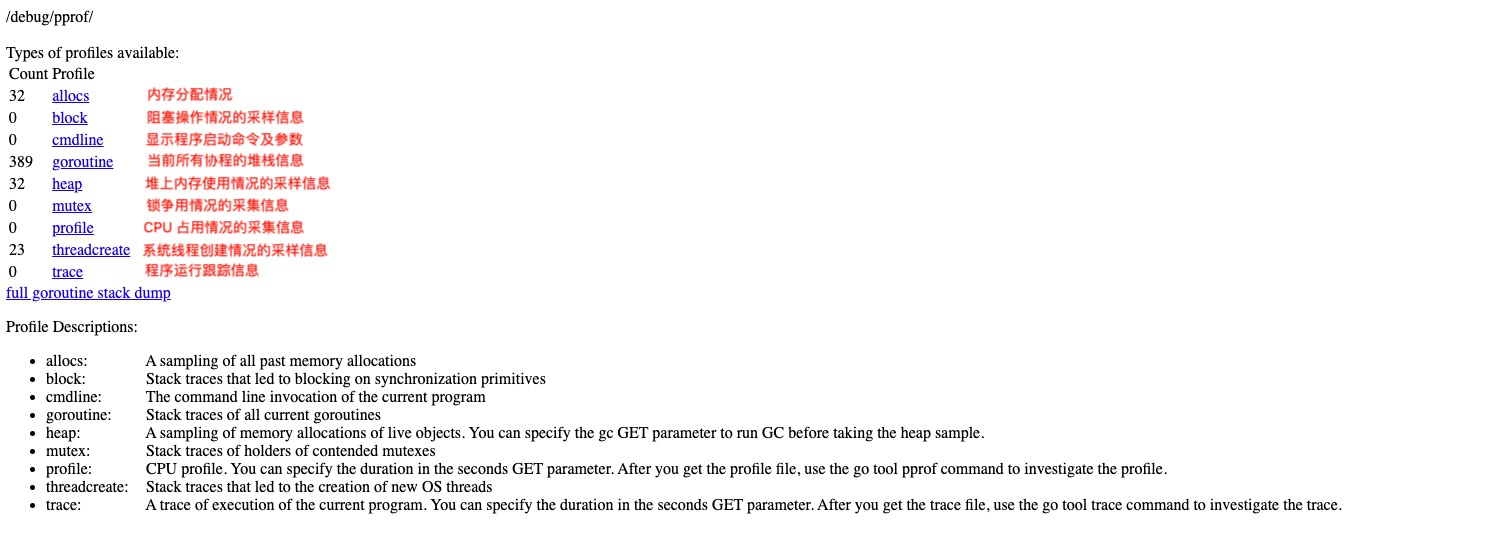
浏览器查看
http:/172.13.5.17:14111/debug/pprof/>
使用命令行查看所有
1
2
3
4
5
6
7
8
9
10
11
12
13
14
15
16
17
18
19
20
21
22
23
24
25
26
27
28
29
30
31
32
33
34
35
36
37
38
39
40
41
42
43
44
45
46
47
48
49
50
51
52
53
54
55
56
57
58
59
60
61
62
63
64
go tool pprof http://172.13.5.17:14611/debug/pprof/profile  # 查看profile

(pprof) top
Showing nodes accounting for 3170ms, 64.69% of 4900ms total
Dropped 260 nodes (cum <= 24.50ms)
Showing top 10 nodes out of 207
      flat  flat%   sum%        cum   cum%
    1180ms 24.08% 24.08%     1180ms 24.08%  runtime.futex
     560ms 11.43% 35.51%      600ms 12.24%  syscall.Syscall
     460ms  9.39% 44.90%      460ms  9.39%  runtime.epollwait
     370ms  7.55% 52.45%      370ms  7.55%  runtime.usleep
     220ms  4.49% 56.94%      300ms  6.12%  runtime.scanobject
      90ms  1.84% 58.78%       90ms  1.84%  runtime.lock
      80ms  1.63% 60.41%       80ms  1.63%  runtime.step
      70ms  1.43% 61.84%     1590ms 32.45%  runtime.findrunnable
      70ms  1.43% 63.27%       90ms  1.84%  runtime.nanotime (inline)
      70ms  1.43% 64.69%       70ms  1.43%  runtime.siftdownTimer
(pprof)

go tool pprof http://172.13.5.17:14611/debug/pprof/heap  # heap 查看那部分代码占比 比较高
-------------------------------- top
(pprof) top
Showing nodes accounting for 28238.94kB, 80.86% of 34922.60kB total
Showing top 10 nodes out of 151
      flat  flat%   sum%        cum   cum%
10752.80kB 30.79% 30.79% 12752.05kB 36.52%  time.NewTimer
 3598.02kB 10.30% 41.09%  3598.02kB 10.30%  bufio.NewReaderSize
 3598.02kB 10.30% 51.40%  3598.02kB 10.30%  bufio.NewWriterSize
 2200.03kB  6.30% 57.70%  2200.03kB  6.30%  google.golang.org/protobuf/internal/strs.(*Builder).AppendFullName
 2054.76kB  5.88% 63.58%  2054.76kB  5.88%  git.huoys.com/indonesia/game/chess/qiuqiu/logic.(*CardList).shuffle
 1999.25kB  5.72% 69.30%  1999.25kB  5.72%  time.startTimer
 1536.56kB  4.40% 73.70%  1536.56kB  4.40%  runtime.malg
 1052.25kB  3.01% 76.72%  1052.25kB  3.01%  sync.(*Map).dirtyLocked
  902.59kB  2.58% 79.30%   902.59kB  2.58%  compress/flate.NewWriter
  544.67kB  1.56% 80.86%   544.67kB  1.56%  bytes.makeSlice
(pprof)

-------------------------------- list 查看方法
(pprof) list shuffle
Total: 34.10MB
ROUTINE ======================== git.huoys.com/indonesia/game/chess/qiuqiu/logic.(*CardList).shuffle in /go/src/git.huoys.com/indonesia/game/chess/qiuqiu/logic/card_help.go
    2.01MB     2.01MB (flat, cum)  5.88% of Total
         .          .      8:
         .          .      9:// 洗牌
         .          .     10:func (p *CardList) shuffle() {
         .          .     11:   p.cardsMap = make(map[xproto.CardID]GoQiuQiu)
         .          .     12:   for _, v := range _goQiuQiu {
    2.01MB     2.01MB     13:           p.cardsMap[v.CardId] = v
         .          .     14:   }
         .          .     15:}
         .          .     16:
         .          .     17:// DispatchHandCardDebug Debug 发牌模式
         .          .     18:func (p *CardList) DispatchHandCardDebug(cardIds ...int) *HandCard {
(pprof)
-------------------------------- web (需要安装graphviz命令才能使用生成一个.svg 浏览器打开即可)


-------------------------------- 下面几个都可以使用 top list web ;或者可以直接 help 查看帮助帮助命令
go tool pprof http://172.13.5.17:14611/debug/pprof/allocs
go tool pprof http://172.13.5.17:14611/debug/pprof/goroutine
go tool pprof http://172.13.5.17:14611/debug/pprof/mutex
go tool pprof http://172.13.5.17:14611/debug/pprof/block
使用浏览器直接查看
-
定位问题
- 查看服务使用 cpu
- 内存使用情况磁盘和 io 使用情况
-
使用工具
-
ps -aux grep qiuqiu ——–> 查找服务 - stop -p pid ——–> CPU 内存
- iotop -p pid ——–> 磁盘 io
-
-
分析问题
-
生成
pprof文件- go tool pprof http://172.13.5.17:14611/debug/pprof/profile (默认放在
cd $HOME/pprof/) - 可以看到会生成这样的文件 /Users/cc/pprof/pprof.qiuqiu.samples.cpu.002.pb.gz
- go tool pprof http://172.13.5.17:14611/debug/pprof/profile (默认放在
-
go tool pprof -http=0.0.0.0:999 /Users/cc/pprof/pprof.qiuqiu.samples.cpu.002.pb.gz (使用浏览器预览生成的文件查看服务状态)
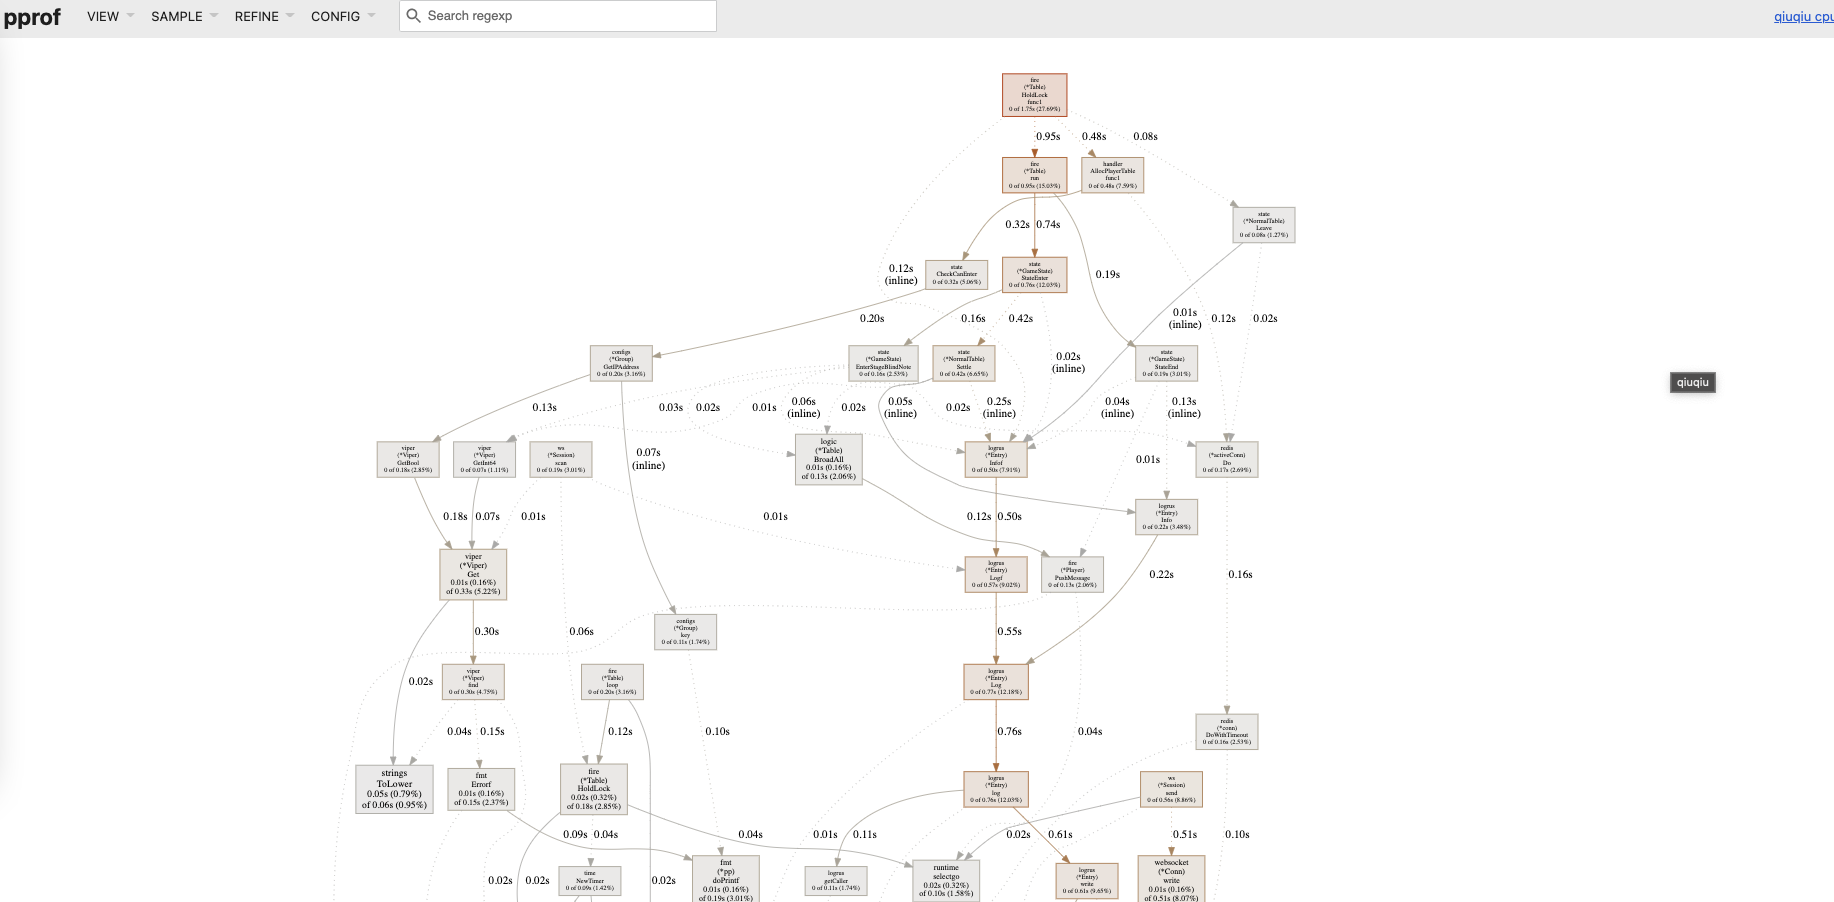
-
查看火焰图方法
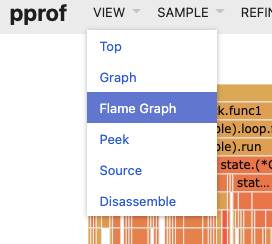
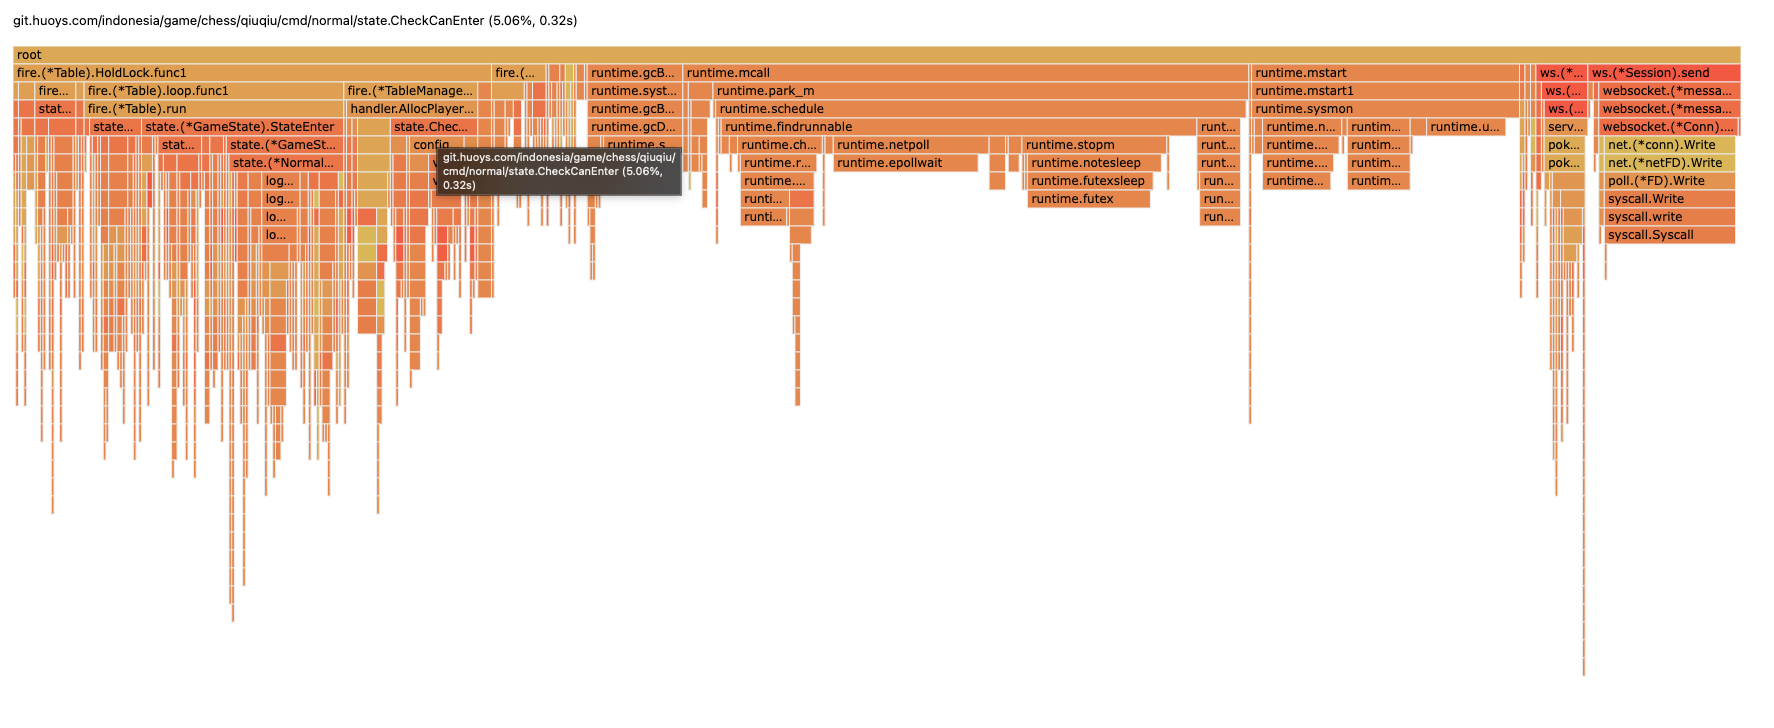
-
火焰图详情
-
This post is licensed under
CC BY 4.0
by the author.